

Inspect your site using the web console
On this page
Use the web console to watch your store render in real time. It shows the Liquid templates behind each request, the time each one takes, and the payment and shipping API calls a request makes, so you can analyze template output and logic, trace render chains, diagnose errors, and find opportunities to optimize.
Before you start
Web console access is granted through a store role. You need a Store Role of type Web Console at level Viewer, assigned to your Salesforce user through a Store User Role that covers the store you want to inspect.
Open the web console
- Open the Store record for the store you want to inspect.
- Click Web Console.
- Wait for the status to change from Connecting… to Connected.
- Click Open Store to launch the storefront in a new tab, or browse to the store yourself in the same browser profile.
Logs appear in the console for each page you load. The console is connected and receiving when a new entry appears in the sidebar as you navigate the storefront.
Web console features
Request logs
- Requests appear in the sidebar as you navigate.
- Only your own browsing activity is logged; other customers’ activity is not visible.
- Logs are scoped to the store you launched the console from.
- Logs do not persist after you close or reload the page.
- Logs are sorted most recent first.
- Each entry shows the controller and action, such as
products#show. - Each entry shows the request duration in milliseconds.
- Red text indicates an error in the request.
- A blue dot indicates a debug call was made.
Log details view
- The request path, HTTP method (
GET,POST, and so on), and duration. - A nested view of the rendered Liquid templates.
- Collapsible nested entries.
- Errors inside a collapsed entry show an error count.
- Filter buttons for All entries, Error entries, and Debug entries.
Add a timer for a section of code
You can add a timer for a section of code to measure the code’s execution time, and record the result in the web console.
Syntax
```liquid
{% timer “label” %} {# liquid code to measure #}
{% endtimer %} ```
Parameters
| Parameter | Type | Required | Description |
|---|---|---|---|
| label | String | Yes | A name to identify this timer in the console output |
Example
```liquid
{% timer “product-loop” %} {% for product in collection.products %} {{ product.name }} {% endfor %} {% endtimer %} ```
The elapsed time for the block is recorded in milliseconds and appears in the web console under the given label.
Code timer rules
- Timers are only recorded during an active console session. The tag has no effect outside of a console context.
- Multiple timers can be used in the same template with different labels.
- Filter timings are also captured automatically for every filter invocation (with line number), without needing the timer tag.
Payment and shipping API logs
The web console logs payment and shipping API calls. These logs provide real-time visibility into API requests and responses for payment and shipping integrations, allowing developers to debug payment and shipping issues without needing access to external logging tools such as Papertrail, Heroku logs, or similar services.
What’s included
When a payment or shipping API call is made, the web console displays:
-
Request details
- Endpoint
- HTTP method
- Payload sent to the provider
-
Response details
- Success or failure status
- Response object returned by the provider
- Error messages (when provided by the API)
Both successful and failed requests are logged and scoped to your current browsing session, consistent with existing web console behavior.
Common use cases
- Debug failed payments during checkout
- Verify successful payment or shipping rate requests
- Identify malformed payloads or missing parameters
- Review provider error responses without backend access.
:::note
Some payment or shipping providers return limited error information. For example, certain APIs may respond with a 400 error without detailed context. However, most providers include meaningful error messages in their response bodies.
:::
Example: successful payment API call
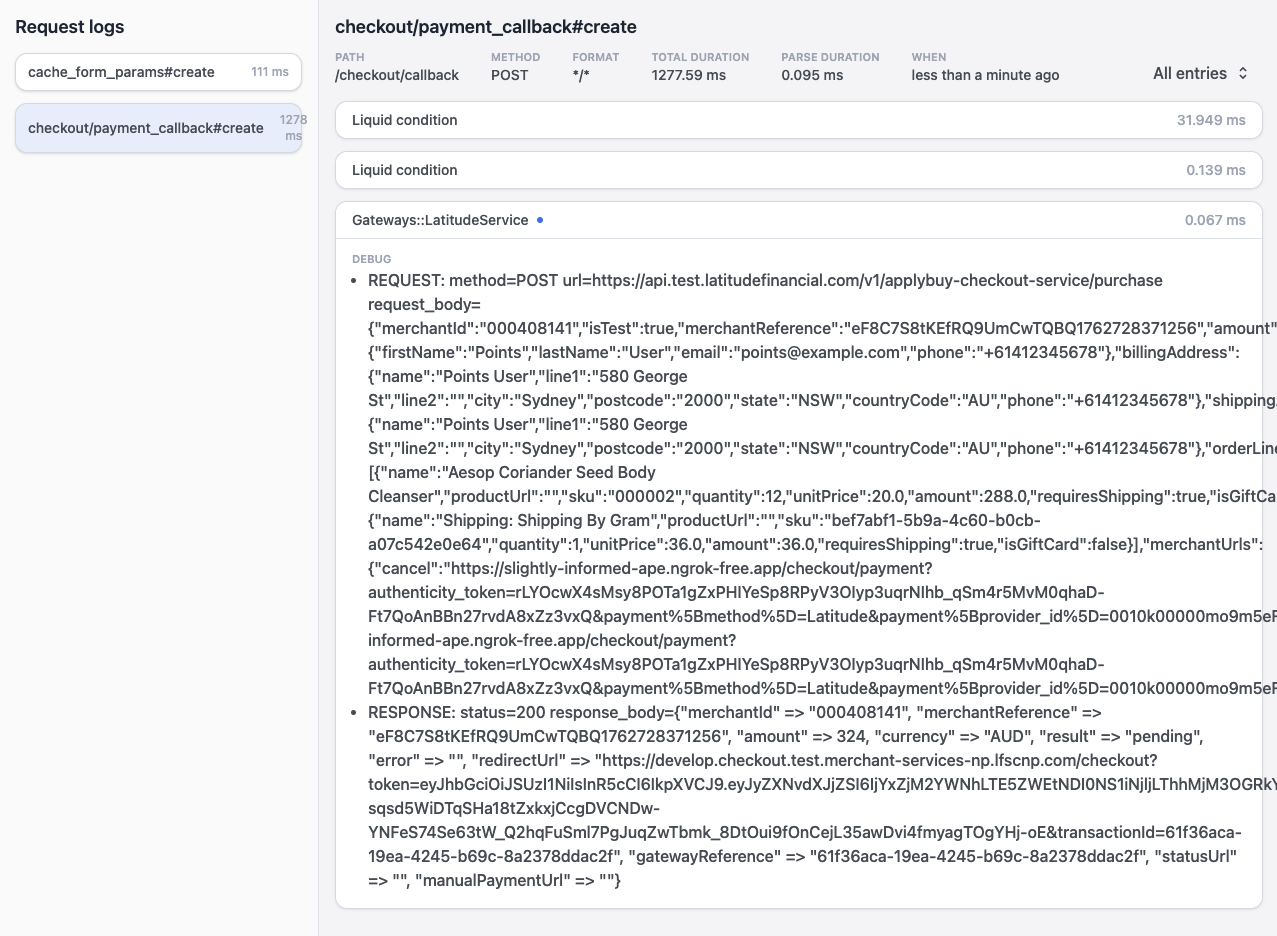
In the example below, a payment provider request completes successfully:
- A REQUEST entry shows the payload sent to the payment API.
- A RESPONSE entry shows a
200status with the provider’s response object. - The request is marked with a blue dot, indicating a debug call.
Example: failed payment API call
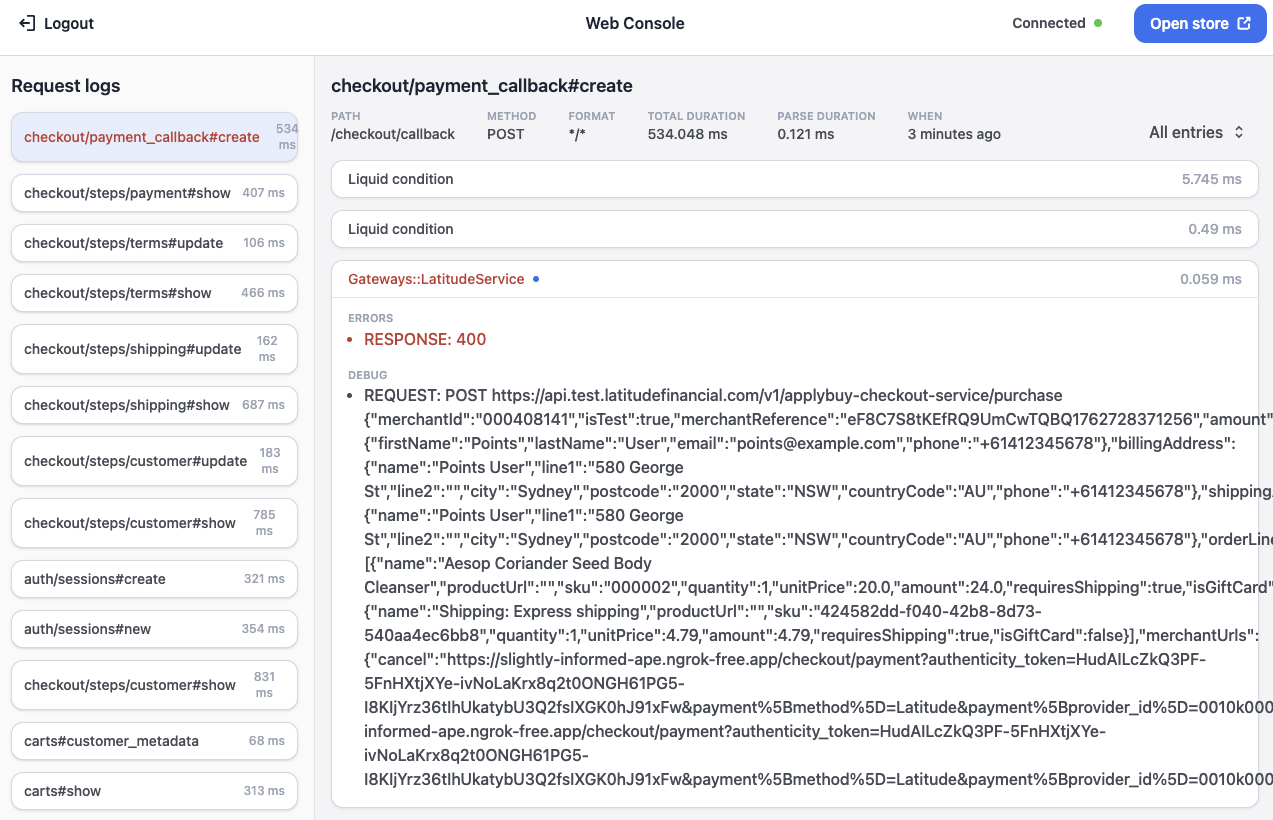
In the example below, the payment API returns a failure:
- The response status is
400. - The request entry is highlighted in red.
- The request and response payloads are fully visible for debugging.
Was this article helpful?
Thanks for your feedback! It helps us improve our docs.